
In the first blog in this series, we set out three levels of our AI strategy: organisation-wide adoption, an AI-first approach to product and engineering, and the development of agents. In Part II, we went deeper on the second level - the tools, roles and system changes transforming how Product, Design and Engineering work day to day.
In this update, we're sharing the latest data, and include new data on quality and non-engineering contributions. We also share the initial results of our ‘positive product increment’ metric we mentioned in Part II that we were developing.
The overall trends are exactly as per Part II – rapid productivity acceleration and role convergence.
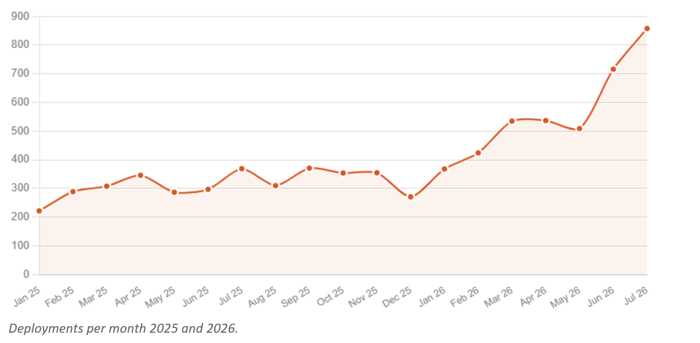
Deployments have kept climbing, with particular acceleration in the last 6 months. Monthly deployments have gone from 222 in January 2025 to 297 by June 2025, 368 by January 2026, and 858 in July 2026 - nearly quadrupling over eighteen months, with the steepest acceleration across 2026 to date. Engineering headcount has actually fallen 16% since the end of 2025 so this is not a headcount effect.
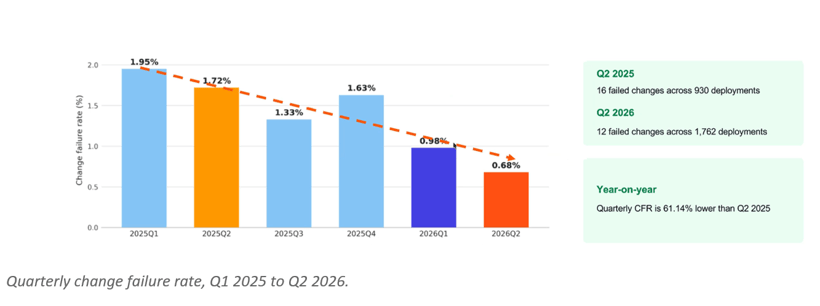
We closely watch change failure rate - the share of production changes that cause an incident, as a measure of quality alongside velocity. It's fallen in every quarter bar one since the start of 2025: from 1.95% in Q1 2025 to 0.68% in Q2 2026, 61% lower year-on-year than Q2 2025. In absolute terms, there were 12 failed changes across 1,762 deployments in Q2 2026, against 16 failed changes across 930 deployments a year earlier - fewer absolute failures despite roughly double the deployment volume. That's a result of the engineering harness described in Part II doing its job: tests, lint, security scans and repository instructions catching problems before they ship. So AI done well can mean both faster speed and lower risk in production releases.
T-shaped working has moved to widespread reality. Looking across our engineers, 83% are now active in two or more stacks (we measure this by analysing PRs by person by stack), up from just 15% before we decided to go all-in on T-shaped last autumn. Over half of our engineers are now fully established T-shaped contributors – up from two engineers a year earlier – with a further 26 developing. Almost all of our frontend engineers have built real backend contribution, the most consistent transition of any group.
The same pattern is extending beyond engineering. In 2026, 53 non-engineers have shipped at least one pull request, while the monthly number of distinct non-engineer contributors rose from 10 in January to 37 in June. This shows that the ways of working described in Part II are taking hold in practice. Product, design and other colleagues are increasingly able to contribute directly to production delivery without lowering the quality bar, because every change is supported by the same engineering standards, automated checks and human review.
Engineering productivity is strongly up and double the benchmark for Very High AI adopters. Output per engineer is up 89% since January – 15.2 pull requests per active engineer in January 2026 rising to 28.8 in June 2026. For June, our weekly PRs per engineer were c6.7. This was almost double the month's Jellyfish benchmark for Very High AI adopters of 3.4. For context, that was our performance level in January of this year. Jellyfish is the most comprehensive quantitative analysis of AI transformation in software engineering, covering >200,000 engineers across >700 companies.
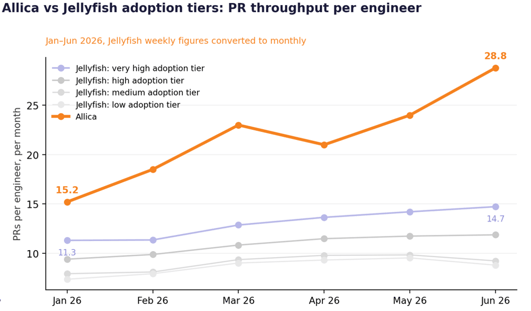
Code per pull request is also up 2.2x over the same comparison, so this is not about making smaller changes. PR review capacity has scaled to match, from roughly 1,330 reviews a month to 3,600, underpinned by AI capabilities, and absorbed by the same teams.
The other comprehensive regular study of engineering output is from DX, covering 500+ companies and 150,000+ engineers. This is highly aligned to the Jellyfish data, showing:
- In Q2-2026 median PR/week for tech companies at 2.1 (9 per month) up from 1.5 in Q3-2025, and states that Financial Services companies have the lowest output (reflecting systemic constraints and compliance requirements)
- In Q1-2026 for daily active AI usage, median PR/week was 2.4 (10 per month). For Claude Code users the median PR/week was the highest at around 4 (17 per month)
The DX study also finds that the industry benchmark change failure rate is 4%, with some companies seeing a 50% rise in change failure as AI output increases.
Taken together, these benchmarks indicate that Allica’s AI-first model is delivering very substantially higher engineering throughput with significantly lower change-failure rates even against high AI adoption benchmarks, and particularly so in a regulated financial services environment. But engineering throughput alone is not the outcome we are seeking.
From engineering throughput to meaningful product output. Higher deployment and pull-request volumes are useful intermediate indicators, but only if they translate into meaningful actual progress for customers and Allica. In Part II, we introduced the concept of Positive Product Increments (PPIs) where we were developing a metric to distinguish genuine outcome value from throughput activity. We now have the initial results on this.
We are using AI to scan all release and linked engineering tickets, initiatives and epics, and then classifying which are PPIs that create a good step forward in customer capability, commercial performance, or risk and resilience. Heads of Product review and sign off the results.
We now have seven months of validated 2026 data, and have applied the same method retrospectively to 2025 (though the 2025 figures have not been through the same human validation, so they should be read as indicative).
Between January and July 2026, our product squads delivered 155 PPIs. Momentum strengthened through the period: July was the strongest month, with 37 increments compared with 11 in January, while 62 were delivered in June and July alone.
The same scan applied to 2025 identifies 128 PPIs across the full year, 72 of them between January and July - so we have more than doubled the rate of shipping substantive improvements.
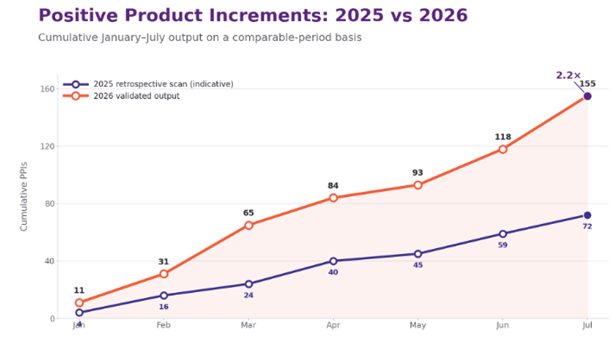
Taken alongside accelerating deployment frequency and falling change-failure rates, this gives us high confidence that our AI-first operating model is converting greater engineering throughput into faster, meaningful product delivery, even with smaller squads and lower headcount.
And as we blogged about previously - Execution is everything: Why speed x quality wins the day.